While we touched on this new feature in our 2013 year-end review, let’s take a more in-depth look at Trends & Charts.
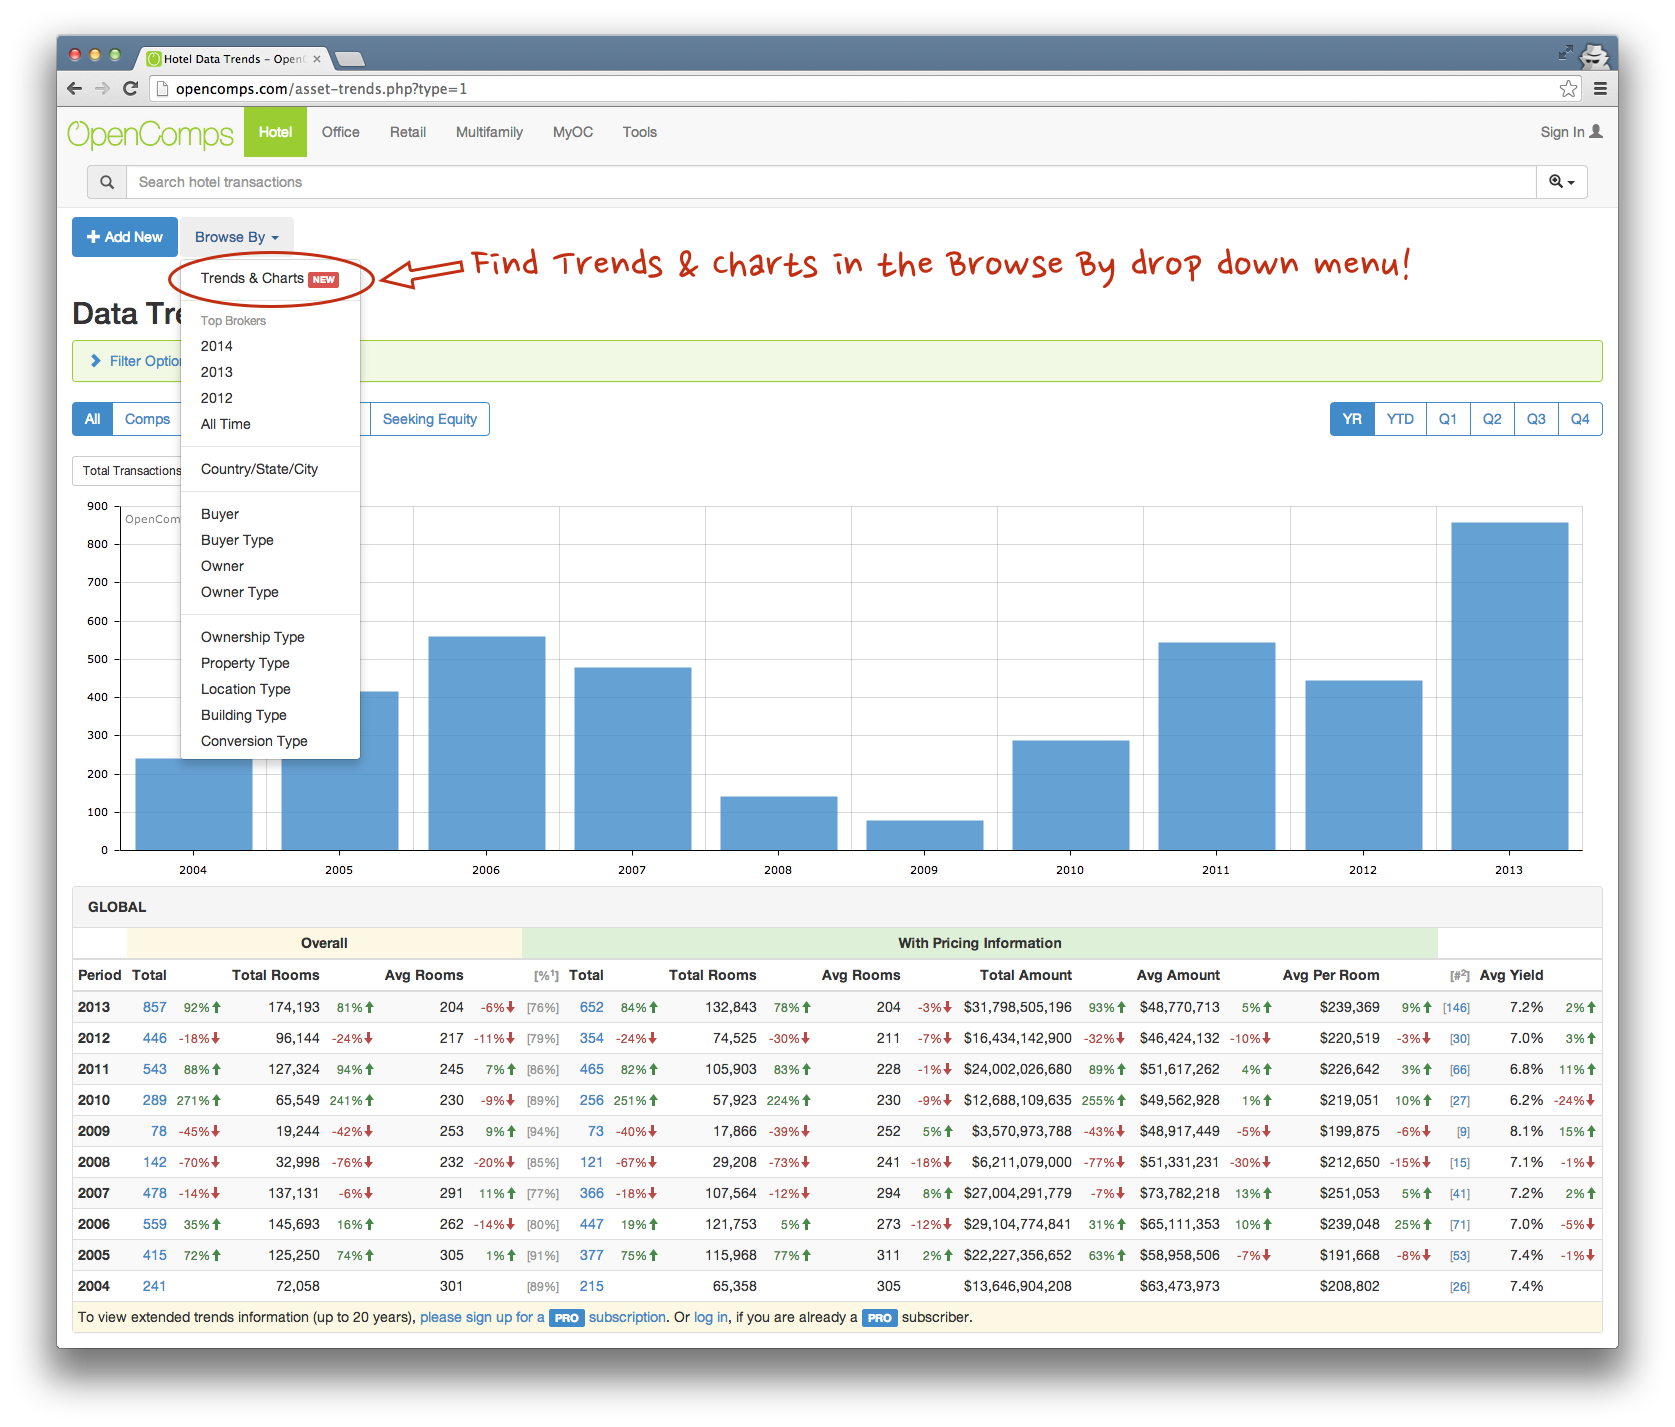
You can find the Trends & Charts section for the desired asset type in the Browse By dropdown menu on pretty much every screen. Once there, let’s take a closer look:
The standard chart and data table goes back 10 years. If you are PRO subscriber, the chart and data goes back 20 years. (The above screenshot is an Admin view displaying all periods.)
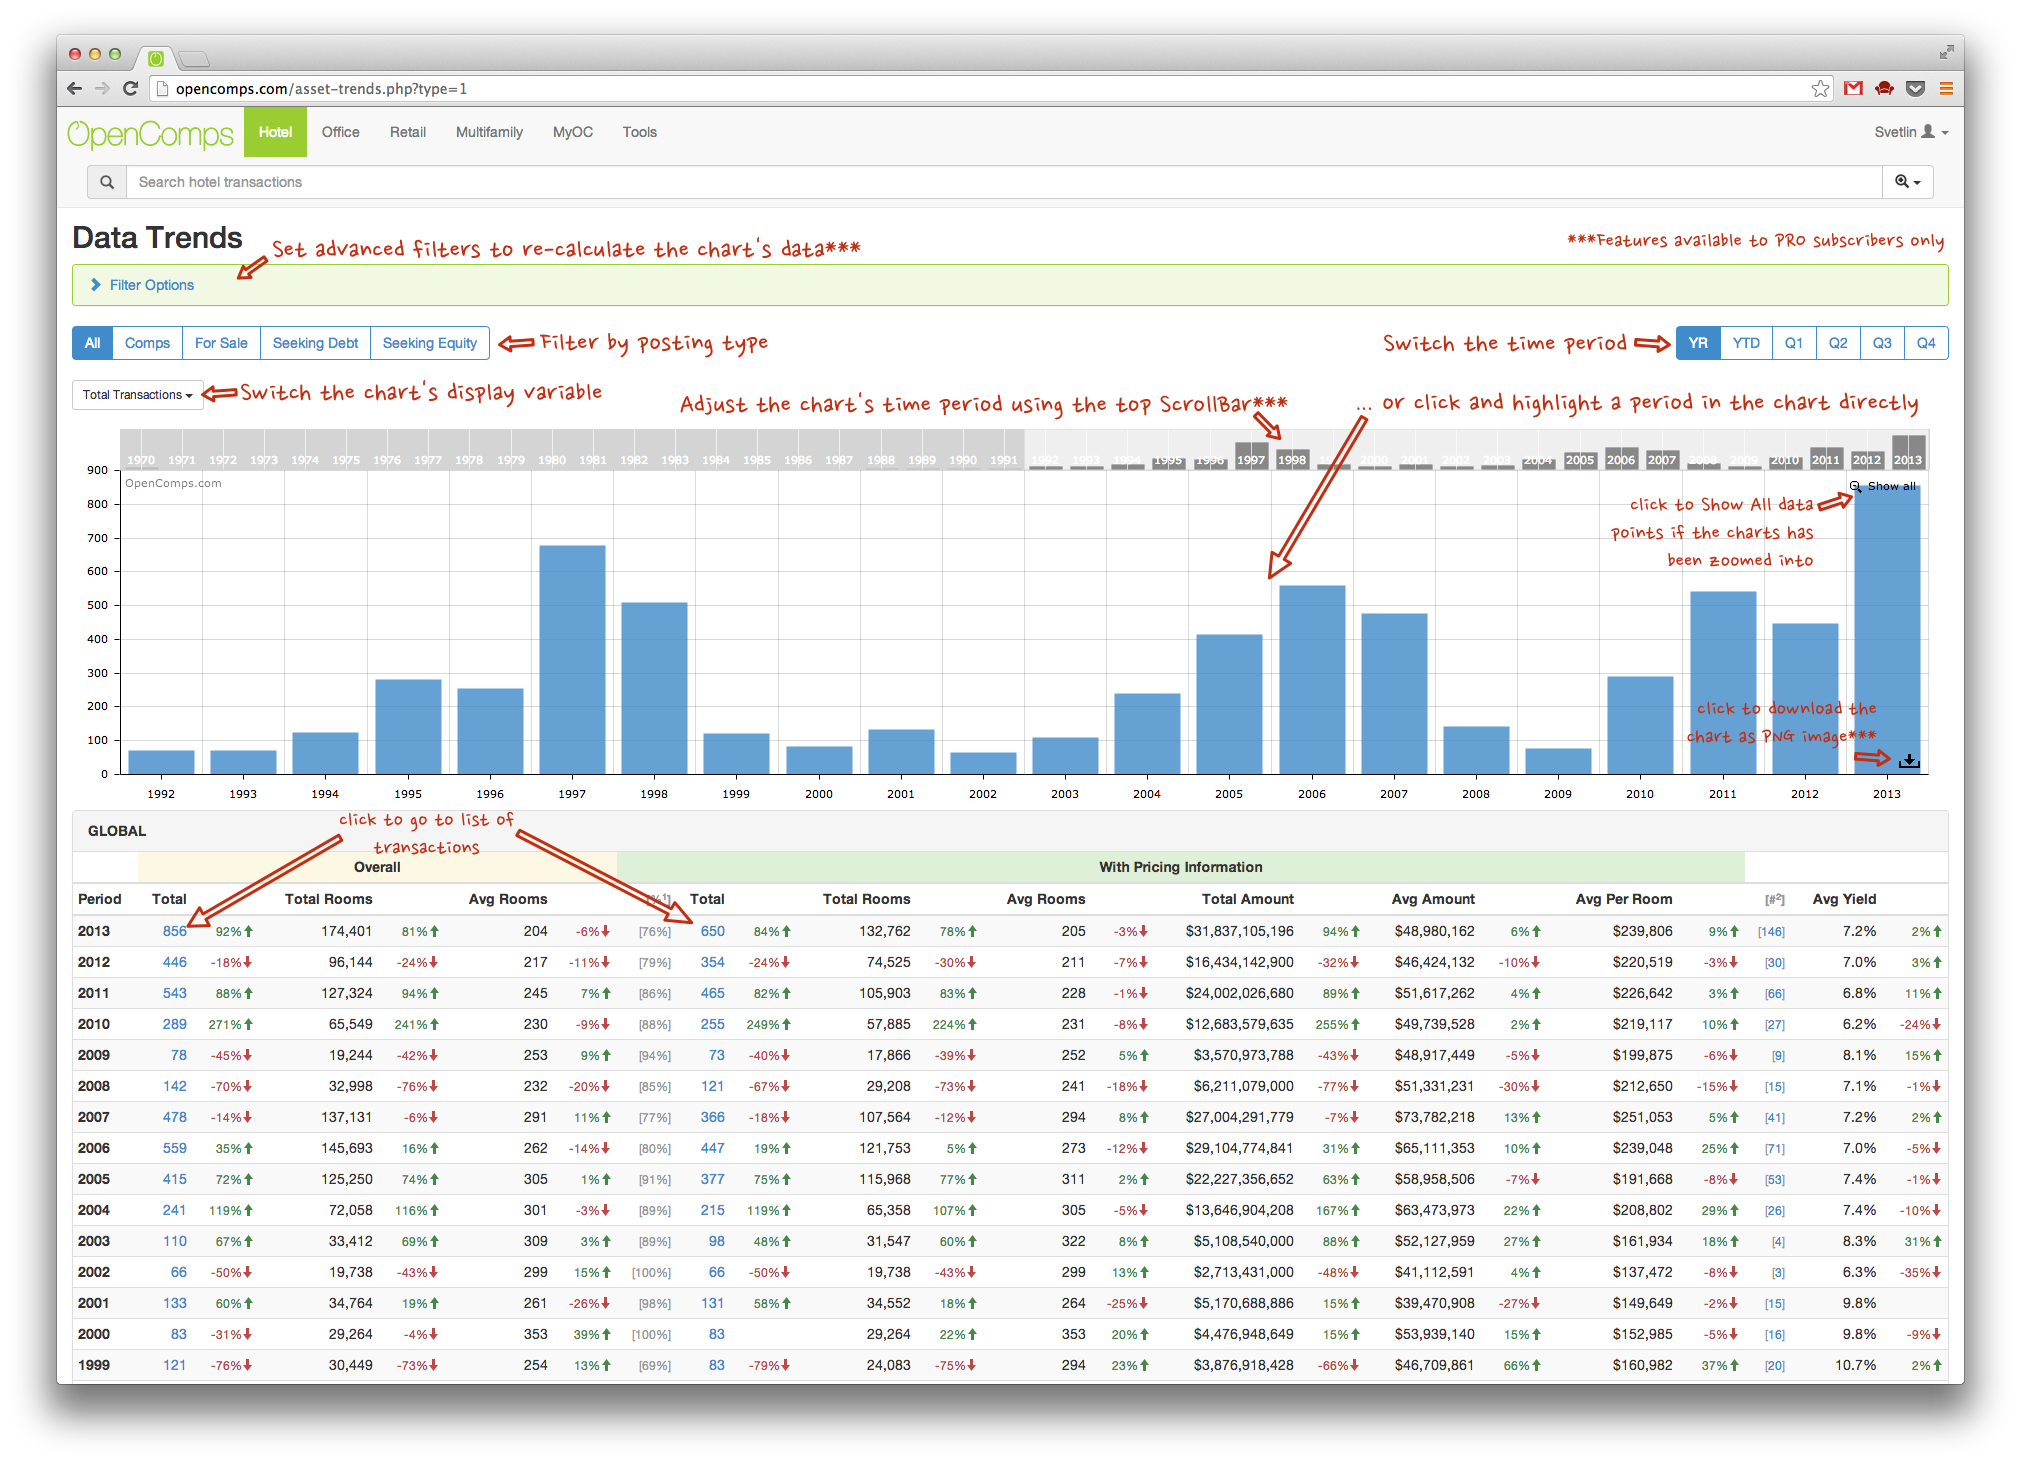
If you a PRO subscriber, you can set Filter Options to manipulate the data sets for the chart. These are all the filters you can find in the Advanced Search feature such as filtering by Country, State or City, Property Name, Street Address, Postal Code, Price/Amount (to/from), Units (to/from), Per Unit (to/from), Yield (to/from), Year Built (to/from), Buyer, Buyer’s Broker, Owner, Owner’s Broker, Notes, Ownership Type, Property Type, Building Type, Location Type and Conversion Type.
You can filter the chart by posting type (All, Comps, For Sale, Seeking Debt or Seeking Equity) or adjust the chart’s time period (YR – Year, YTD – Year-to-date, Q1 – first quarter, Q2 – second quarter, Q3 – third quarter or Q4 – fourth quarter) using the large blue toggle switches on the left and right above the chart.
On the top left of the chart, you can switch the data variable displayed in the chart using the dropdown menu. You can view Total Transactions, Total Units, Average Units, Total Transactions With (recorded) Value, Total Units (for transactions) With Value, Average Units (for transactions) With Value, Total Amount (for all transactions), Average Amount (per transaction), Average (amount) Per Unit, and Average Yield.
If you want to “zoom in” on the chart – i.e. select smaller time period than the initial 10 (or 20) years – you can click on the chart and highlight the period you want. Use the “Show all” button in the top right to reset the chart/zoom out. If you are a PRO subscriber, you will also see a Chart Scrollbar on top of the chart that allows you to manipulate the time period you see in the chart by expanding or contracting the period using the side handles or shifting the period left or right by clicking and dragging the active area.
If you are a PRO subscriber, a button in the lower right corner of the chart will allow you to download the chart as a PNG image in one click.
You can “follow” the data by clicking on the hyperlinks in the Total Transactions, Total Transactions with Pricing Information or # (of transactions with yield information) columns.
We are really excited about Trends & Charts and we hope you are too. If you have any thoughts or ideas, let us know!