
With the second quarter behind us, we wanted to update you on the volume of transactions we recorded in OpenComps and the trends we are observing. We also take a look at the first half of the year as well.
The overwhelming feeling for Q2 activity is… whew! Things are cooking and stirring across all the asset types and assets are trading at a fairly brisk speed.
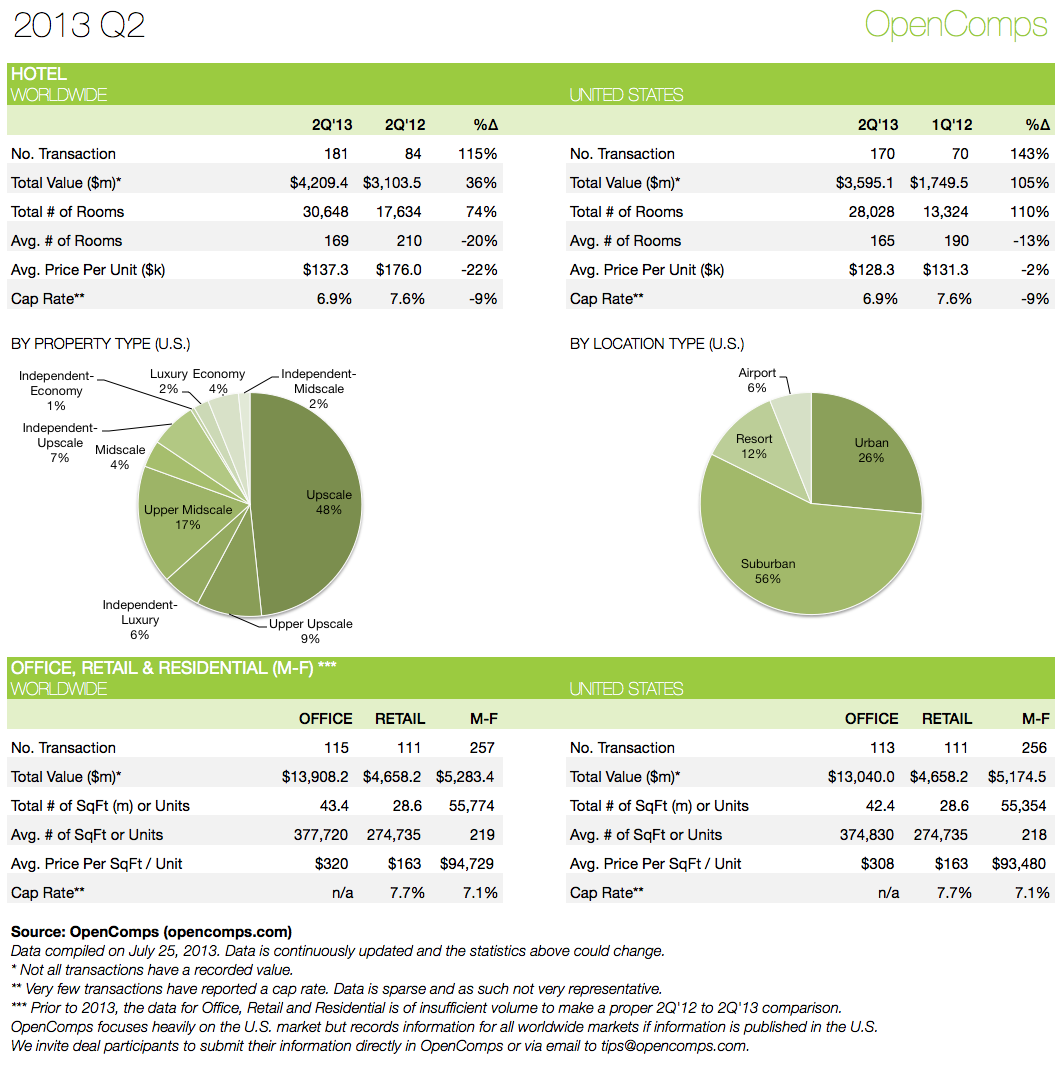
In Hotels, for the Q2’2013, we recorded 181 transactions worldwide and 170 in the U.S. That compares to 84 and 70 for Q2’2012, respectively. That’s a 115% and 143% increase in number of transactions, respectively, which really signifies the fertile transaction environment we are in right now. The volume in the U.S. jumped from $1.75 billion in Q2’2012 to $3.6 billion in Q2’2013.
Now, the Q2 statistics in the Hotel section were likely heavily impacted by the closing of the acquisition of Apple REIT Six Inc. by Blackstone Group LP. The 66-hotel, $1.15 billion portfolio acquisition was first announced in November 2012 and finally closed on May 14, 2013. We wrote about it previously! The composition of this transaction had a lot to do with the shrinkage of the average number of rooms observed in Q2’2013 (169) compared to Q2’2012 (210), the average price per room ($137,300 vs $176,000) as well as the skewing of the property type and location type distribution towards Suburban Upscale properties.
Even without this deal, however, the fast and increased pace of transactional activity in the Hotel sector is unquestionable. And the favoritism of Upscale Suburban properties (those Courtyards, Hilton Garden Inns, etc.) is here to stay as the action has moved away a little from the big trophy deals in the major markets (well, except Hawaii!) to secondary and tertiary markets.
Similar torrid acceleration of trades is happening in the Multifamily (Residential) sector where we recorded 256 transactions in the U.S. for Q2’2013. This compares with only 72 in the first quarter of 2013 (again, we are not doing comparisons with 2012 as perviously explained). This resulted in a transactional volume of close to $5.2 billion and over 55,300 units. The average property size was 218 units trading for $93,480 per unit on average.
The Office and Retail sectors also recorded significant volumes in Q2’2013. We recorded 113 Office transactions and 111 Retail transactions in the U.S. with total volumes of $13.0 billion and $4.7 billion, respectively.
In the year-to-date (first half) summary, there were 338 Hotel ($10.1 billion), 184 Office ($22.6 billion), 151 Retail ($8.4 billion) and 329 Multifamily ($7.4 billion) transactions recorded in OpenComps. We believe that we have been able to actively monitor the majority of the significant commercial real estate transactions in these sectors over the past half year. We hope to continue to maintain our good coverage in all sectors.

To all the third-party deal participants out there – brokers, appraisers, property managers – you’ve likely worked hard to get these transactions closed. Get the proper credit for your work! Review the information in OpenComps and feel free to enhance it or contribute new data points. OpenComps is open for your contributions and basic registration is free!
Lastly, we would like to thank all of our Pro Monthly and Pro Annual subscribers. We appreciate your support of our product and look forward to your feedback of how we can make it better.