
When we set about to write the 2013 review and compile the data – as any good writer – we reviewed our 2012 post. And we realized we were probably going to finish our 2013 piece with the same wish: “to bring our subscribers a more visual and immediate way to better understand the trends that are occurring in OpenComps’ dataset.” And we didn’t want to make the same promise twice. So we stopped writing reviews and started writing code!
Today – together with our 2013 review – we are proud to announce the new Trends & Charts section (see here for hotel, office, retail or multifamily). Currently, you can find it in our Browse By section (dropdown) together with the other data aggregation screens. And we are making it open for every one, reserving for our PRO Subscribers the advanced features such as filtering, longer time period (20 years) and advanced chart tools such as data zoom and save to PNG. This charting tool combined with its extensive search filter can produce really outstanding data insights. We hope you will consider unlocking it’s full potential with a PRO subscription.
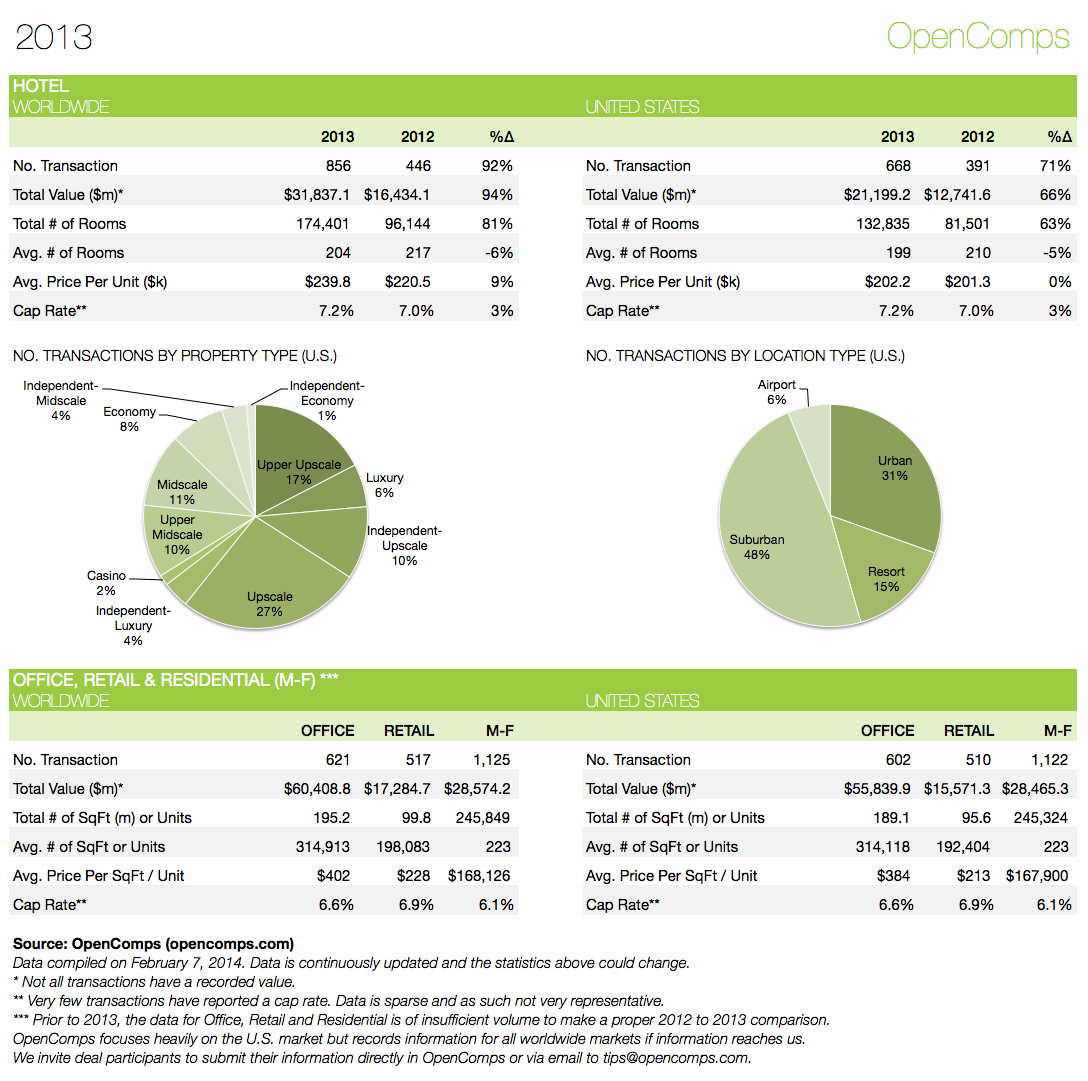
And now onto our 2013 review. The chart that follows gives you a quick overview.
Hotel
In 2013, a total of 856 global hotel transactions were recorded in OpenComps. This was a significant (92%) increase over 2012, which has only 446 transaction. With over $31.8 billion aggregate amount, 2013 volume is also up 94% over 2012 whose transactions total only $16.4 billion. The average number of rooms per transaction is fairly flat, down 6% from 217 to 204, while average price per room increased 9% from $220,500 to $239,800 per room. Cap rates stayed essentially flat, up slightly to 7.2% from 7.0%.
Transactions that took place in the United States totaled 668, with 132,835 rooms, a gross volume of $21.2 billion, average room count per transaction of 199 rooms, an average price per room of $202,200 and average cap rate of 7.2%. These were also significantly higher than 2012 volume with a 66% increase in aggregate volume.
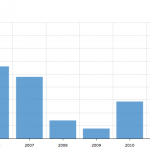
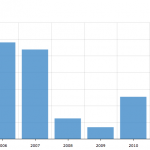
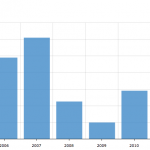
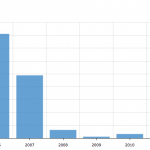
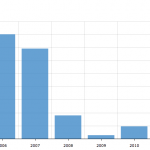
In short, 2013 was a blockbuster year for hotel trades! As we wrote back in 2012, we saw a softening of the volume and pace in 2012 following the growth period of 2010-2011 (post the recession lows of 2008-2009). Well, 2013 has come back roaring, easily surpassing prior gross volume and total transaction peak in 2006 ($29.1 billion and 559 transactions). Can 2014 surpass this? We certainly think the market is heading that way.
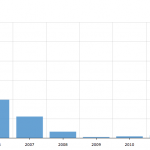
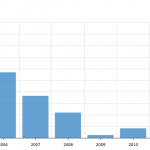
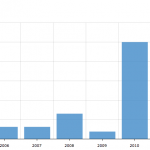
Here are three charts showing the ten-year trend in Total Transactions, Total Amount (volume) and Average Amount Per Room, straight from our new hotel Trends & Chart section.
In the following three sections, as we promised in the beginning of the year, we have re-doubled our efforts and attention. We really want your participation but we believe we are supplying good amount of “electricity” in the system to more than satisfy your read of the market pulse. While we are pretty confident that in the hotel sector we are close to 100% coverage in the United States – for institutional real estate deals – in the office, retail and multifamily, we are probably at a solid 80-90%. If the deal really mattered, we took note of it.
Office
For 2013, currently, there are 621 global transactions totaling $60.4 billion worth of real estate, more than 195 million square feet, with an average deal size of approx. 315,000 square feet, and an average price $402 per square foot. Of those, 602 transactions are in the United States, with total volume of $55.8 billion, 189 million square feet, 314,118 square feet per transaction, and $384 per square foot average price. The average yield recorded for 2013 was 6.6%
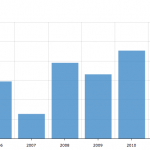
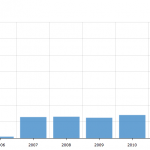
Here are three charts showing the ten-year trend in Total Transactions, Total Amount (volume) and Average Amount Per Square Foot, straight from our new office Trends & Chart section (keep in mind the above commentary for reduced industry coverage from 2008-2012).
Retail
There are 517 recorded global retail transactions for 2013 with a gross volume of $17.3 billion. With close to 100 million square feet of total space, the average transaction was close to 200,000 square feet. This translated into an average price per square foot of $228. For U.S., the total transactions are 510, total volume of $15.6 billion, total square footage of 95.6 million, average square feet per transaction of 192,404, and average price per square foot of $213. The average yield for retail transactions in 2013 was 6.9%.
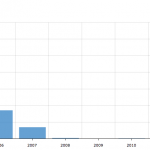
Here are three charts showing the ten-year trend in Total Transactions, Total Amount (volume) and Average Amount Per Square Foot, straight from our new retail Trends & Chart section (keep in mind the above commentary for reduced industry coverage from 2008-2012).
Multifamily
We had a really strong year covering multifamily transactions. But we know the activity was even greater as there were a number of portfolios that traded hands and quite often under the radar. We really need your participation here as this is an exciting sector where we really would love to get to 100% coverage, especially in the U.S.
For 2013, in OpenComps, there are 1,122 U.S. transactions with a gross volume of almost $28.5 billion! This amounts to over 245,000 units changing hands with an average transaction size of 223 units. The average price per unit is $167,900 and the average going-in yield is 6.1%. (Very slight coverage outside of the U.S., so we will skip the recap there).
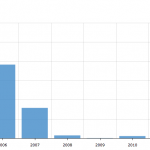
Here are three charts showing the ten-year trend in Total Transactions, Total Amount (volume) and Average Amount Per Unit, straight from our new multifamily Trends & Chart section (keep in mind the above commentary for reduced industry coverage from 2008-2012).
We hope you enjoyed our 2013 review and our new Trends & Chart tool. This tool significantly increases the transparency of the data housed inside OpenComps. However, for OpenComps to truly capture the transaction activity in the United States and globally, we really need YOU! Remember, the dataset is open to and free for community participation. Our aim is not to be the next research company but rather to be the technological platform that enables increased transparency and better communication for the global institutional commercial real estate industry. We hope you join us in 2014! We wish you much success throughout the year!